I previously wrote on Queueing Theory and titled those posts as Queueing Theory: Part 1 and Queueing Theory: Part 2. You can also view all 40+ articles on Queueing Theory.
Today, I’ll briefly explain how to set-up a model in Microsoft Excel to simulate a Single-Server Queue. These Queueing Theory Calculations can then be used in various settings. Entirely up to you.
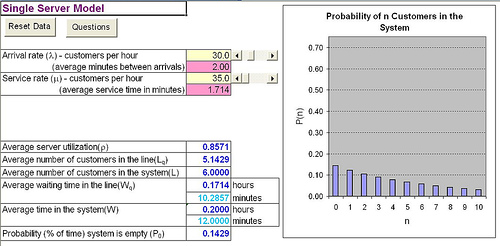
Queueing Theory shows the interplay between the arrival rate and the service rate, which both reveal the characteristics of the queue and, ultimately the customer experience. The items in parenthesis below are the cell/row numbers in my example image (see below).
- Arrival Rate: Set-up a field to accept the Customers Per Hour (B5); Followed by a field to accept the Average Minutes Between Arrivals (60/B5).
- Service Rate: Next, we need to set-up the Service Rate. To do this, create a field that will accept Customers Per Hour (B7). This is followed by a field to accept Average Service Time in Minutes (60/B7).
Now, we can learn about the characteristics of the queue and also how the customer might experience the queue:
- Average Server Utilization: Create a field to calculate the Average Server Utilization (B5/B7).
- Average Number of Customers in the Line: Set-up a field to calculate the Average Number of Customers in the Line (B5^2/(B7*(B7-B5))).
- Average Number of Customers in the System: Now, create a field to calculate the Average Number of Customers in the System (B5/(B7-B5)).
- Average Waiting Time in the Line: Now, we can determine how long it is, on average, for a customer to Wait in the Line in hours (B5/(B7*(B7-B5)) and in minutes ((B5/(B7*(B7-B5)))*60).
- Average Time in the System: System here is defined the cumulative time of (Waiting in the Line + Being Served). For Hours, create a field that will calculate the following (1/(B7-B5)) and for Minutes ((1/(B7-B5)*60).
That’s it. With a few simple calculations we can determine the the load of a system the how long it is on average for a customer to wait for service. Queueing Theory is very pragmatic, applicable, and fairly easy to do. There’s a lot of quant-jock mystique around it, but it’s really not difficult to understand and it can really impact how companies conduct business. Where can you apply this?
Any business process where lines are a matter of fact — this means:
- Emergency or Doctor’s offices
- Restaurants
- Server Load in a network environment
- Fulfillment/Distribution Center or Warehousing
- Project Management
- Call Centers
- Software Engineering
- etc…
Queueing Theory isn’t used enough, in my experience. More businesses could stand to benefit from its use and application. At the end of the day, simply learning about how long a customer might wait in line will help a business better design their service to provide more value-add to the customer experience.
Become a Lean Six Sigma professional today!
Start your learning journey with Lean Six Sigma White Belt at NO COST


Andy Sanyal says
What happens if my service rate is lower than my arrival rate? How do I deal with the negative values?
James Nutting says
Hallo,
I am trying to discover if there is a reasonably simple way to predict the probability of a Queue Wait time exceeding a certain length for a multi-server queueing system with a poisson arrival rate and a constant service rate. For example, for a call centre with a call arrival rate of 50 / Hour, and a service time of 5 minutes, how can I calculate how many servers I will need in order that 80% of calls have a wait time of > 20 seconds.
I would be very grateful if you could let me know whether this calculation is possible, and if so, what the equation is. Many thanks
James Nutting
John says
I notice that the probability (% of time) is missing from your excel instructions, can you please include it?
Marcela Linares says
Does this model only work for a single server? I am trying to calculate the average number of parts in each of the workstations in a paint shop. Do you think I can use this approach?
Jen says
I am trying to apply your spreadsheet calculations to a queuing line for access to a high school parking lot. Actually, I would like to create two scenarios, as a demonstration of what appears to be faulty thinking.
Approximately 380 student & parent-driven drop-off vehicles arrive within a 25 minute period to access parking at the school. (Approximately 1/5 of the vehicles are parent driven). The in-Queue is a 1 mile stretch of county road that runs from a traffic light to the school. Prior to that, students arrive from any one of three directions at a variable rate. The traffic light throws a dimension into this that we really do not need to consider because the queue is consistently solid for the whole mile for at least 15 of the 25 minutes. Suffice it to say that everyday (M-F), a line forms from the light to the school entrance… bumper to bumper. The dead-end county road has light commuter traffic – mostly out to the light… maybe 30-35 vehicles (including school arrivals) within that same 25 minute period. Buses have another entrance.
The students have devised a “brilliant” way to circumvent interference by the out-traffic, without considering how much they are slowing down the in-traffic by doing so. Periodically, a student will drive past the school entrance (there is a double lane to facilitate thru in-traffic). These students then make a u-turn at the next available community entrance. Each student who does this then helps create a 4-way stop situation (thereby causing a queue to form for the out-traffic) by letting alternating in-traffic make the turn into the school. In doing so, they are probably doubling the wait time for those students in the in-traffic queue.
How best to show the difference between this method and allowing the thru out-traffic to flow at 30 mph with no stops so they are not “in the way” of the students waiting to turn? Obviously those students approaching the turn into the school when there are no outbound vehicles would not have to come to a complete stop.
I would like to demonstrate for a math class how much time is added to each student’s wait time by their “brilliant” 4-way stop approach. Just the hesitation alone while everyone ensures the out-bound vehicle is going to allow the in-bound vehicle to turn can be 3-5 seconds… not to mention everyone having to come to a full stop at this point.
Steve says
I notice that the probability (% of time) is missing from your excel instructions, can you please include it?
Carl says
The probability is simply 1-Utilization rate.
uthman says
I want to apply queueing theory in bank to see how long a customer spend on queueing before. Bn serve. How can I get my data
John says
I want to apply queuing theory on highway toll plazas to see how long vehicles will spend on queuing before being served.
John says
Can you help me with a possible methodology?