In a lot of business analysis, there’s quite a bit of art, not just science. In this article, I employ science, but there’s definitely some art involved too. And, just like the first rule of forecasting is that it’s always wrong, take this regression with a grain of salt. For the purposes of the project, it was sufficient, but certainly not worthy of much else.
Sometime ago, I was able to do some work involving advanced statistics for a very complex process. This very large healthcare company was struggling with absenteeism issues — that is, the call center representatives would sometimes just not show up for work, or have other human resources issues. I wasn’t privy to those details, and I didn’t really care. But, I was concerned about the impact that absenteeism had on service level, which is defined as
{(sick days) + (leave) + (other) + (extended)
÷
(total hours for time period)}
Whenever you have a situation where you want to learn more about the impact of one or more variables has on another, then this business problem can be best understood with the Regression.
Regression Analysis
Regression deals with relationships between variables and also with Prediction: the ability to accurately predict behavior not only makes you more confident about decisions, but also implies an understanding of the processes at work. Regression in all its shapes and forms remains the central workhorse of social science research — economics, sociology, psychology, and is used in many areas of business and technology. It is central to techniques like conjoint and discrete-choice analysis; in fact, many pieces of theGoogle’s MapReduce technology (then do a CTRL-F on “Regression”) utilizes the regression — the way it is computational linguistics is to reduce noise in the data, in conjunction with Bayesian Statistics.
The problem above is a fairly simple one, but one that wasn’t fully understood in a quantitative way. But, with data to support people’s hunches that — yes, absenteeism does in fact impact service level — the company could have some solid evidence.
Regression Heuristics
- Predictor and Response: The predictor (x) is the variable we suspect has an influence on the response (y) variable. For our purposes, (x=absenteeism), and (y=service level).
- Intercept: In a regression equation, the intercept is the value of the response (y) when the predictor (x) equals zero.
- R^2: This is a mathematical term that describes how much of the variation in the data is explainable by the regression model. This value is between 0.0 and 1.0. The closer the R^2 value is to 1.0, then the more successful the regression model is in explaining variability in the data. The the R^2 is 0.0, then that means knowing (x) does not help us predict what (y) will be; in other words, it’s no better than chance or guessing.
- Slope: The slope of the regression line depicts the association between the (x,y) pair. In other words, in a regression the slope is the expected change in y for each unit change in x.
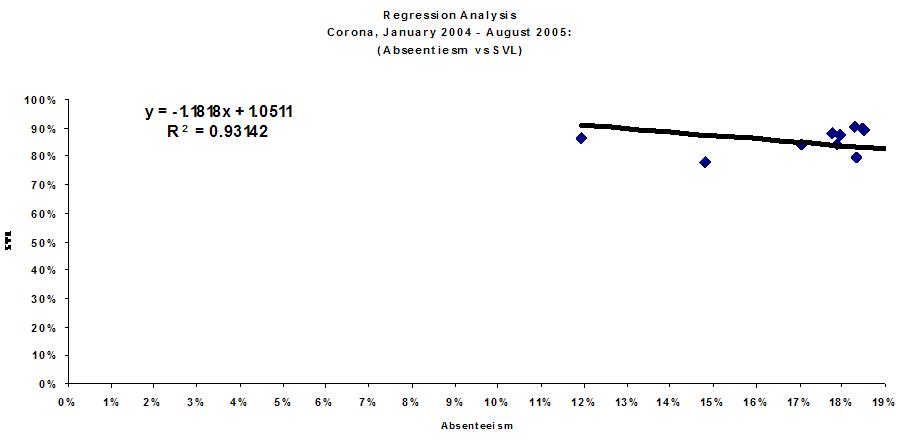
Above is the plot for the analysis of the absenteeism problem described. The data above allows us conclude the following:
- For a 1.18% decrease in absenteeism, we can probably expect a 1.05% increase in service level.
- There is a very strong relationship between service level and absenteeism as evidenced by the R^2 value of 0.93, which means that much of the data is explained by the regression model.
The data and analysis above supports the hunch that many people already had and, it’s pretty obvious in a lot of ways. So, why the analysis? Well, the company was a union shop and this topic was a very big union topic. The company now had hard data to show the union during their labor negotiations that, yes, absenteeism impacts the company and the customer in a very specific way. This data was used to leverage the negotiation process in favor of the company. Without the data, negotiating this piece would probably be much more difficult and may not have gone in favor of the company.
Conclusion
Regression is the workhorse of many important business-type analysis. I’ve learned during my short career that it’s not used nearly as much as it ought to be. Later, I’ll show how Regression is used in computational linguistics — parsing large corpora (like the Brown Corpus) — and how discrimant analysis (a type of regression) helps to reduce noise and expose the data that is useful.
Become a Lean Six Sigma professional today!
Start your learning journey with Lean Six Sigma White Belt at NO COST


Koen lenssen says
You need more detail no? Otherwise unions could use it in their favour (stress causing sick levels to rise so more staff is needed…).
Interesting analysis though. It’s always good to quantify the information!
BR
Koen
Cheddah Yetti says
Since I 1) don’t know you personally and 2) the impersonal nature of the internet makes criticism come off harder than it would in person, I preface this comment by saying I don’t mean to be a jerk with this comment.
However, that analysis is worthless. The influence of the outlier point to the left on the regression line is easy to see from the naked eye. I’m sure you know how to test it, but for those out there not as statistically inclined there is an easy way: remove the point and rerun the regression.
My bet is if you took out the 90%/12% point, the slope now shifts to positive, and r-squared remains high. In all likelihood you’d expect the relationship you found to be true, but if truth was leading this project you’d have to explain the effect that outlier had on the data. Of course, management wouldn’t want to hear it, but it is the truth.
psabilla says
@Cheddah,
You’re right — the analysis above isn’t perfect by any means. There are 2 specific things I could have done to make the analysis more robust:
(1) Gather more data points — Doing this will ensure that the R^2 is more firm and accurately explains the variation in the data set.
(2) Remove Outliers — Because my data set wasn’t large, the presence of outliers massively influences the direction of the regression line — that is, the outlier draws the regression line towards itself. I can avoid this if I do (1) and also remove outliers where it makes sense to remove.
Given both (1) and (2), I went with the data I did have, warts and all. In the end, the business was able to go with my recommendations and the analysis brought about a positive and pragmatic result. From a researcher’s perspective, I could’ve done much more to make the analysis firmer than it is.
I appreciate the comment and don’t ever worry about being harsh or anything. No big deal at all. Arguments of this type are about ideas, not people. Thank you for your perspective; I appreciate it.
Rich Neapolitan says
I would like to use your linear regression picture in an artificial intelligence text I am writing. Can you grant me permission.
Thanks,
Rich
Pete Abilla says
Sure.
David says
In this regression example, did the data come from a population or a (randomly drawn) sample? I cam across this article while researching whether regressions can be performed if you have access to population data. In textbook examples of regression analysis, usually you take a representative sample, run a regression, and make inferences about the unknown population. But, in this example, if your business keeps complete records of service level and employee absenteeism, then would you still need to do random sampling?
In your experience, do business analysts do random sampling?
Thanks,
David