You are here: Lean Six Sigma Home » Six Sigma » Process Bloat, a Hidden Indigestion (Process Cycle Efficiency)

Process Bloat, a Hidden Indigestion (Process Cycle Efficiency)

by Pete Abilla on April 21, 2009

Interested in a free 25+ eBook on the 7 Wastes? Please DOWNLOAD HERE.

bloated processes, lean six sigma

The Hidden Factory is a term that refers to activities in an operation that were not designed into it, but grew over time as workarounds for the current process.  Most organizations have some form of a Hidden Factory and being able to “see” these hidden factories in an organization requires learning to see what waste is and understanding that waste in any operation — service or manufacturing — can be a substantial drain on the bottom line, top line, on employee morale, shareholders and, most importantly, the customer.

In fact, one very important litmus test for an activity is this:

If the customer knew the details of process x, would she be willing to pay for it?

In other words, suppose substantial rework was required to manufacture a widget and that rework cost was baked-into the cost of 1 unit of a widget, would the customer be willing to pay for the firm’s defects?  Would the customer be willing to pay for the firm’s internal inefficiencies?

What is a Process?

A process is an systematic activity comprising of smaller activities that culminate in an outcome — service or product. A process can take up time, space, and resources. All processes can be categorized into the following categories: Value-added, Non-value added but necessary, and Non-value added.

From the Customer’s Perspective:

  1. Value-added: This step in the process adds form, function, and value to the end product and for the customer.
  2. Non-Value-Added: This step does not add form, function, or assist in the finished goods manufacturing of the product.
  3. Non-Value-Added-But-Necessary: This step does not add value, but is a necessary step in the final value-added product.

(2) & (3) naturally create waste, of which there are 7 types:

  1. Over-Production: Producing more than is needed, faster than needed or before needed.
  2. Wait-time: Idle time that occurs when co-dependent events are not synchronized.
  3. Transportation: Any material movement that does not directly support immediate production.
  4. Processing: Redundant effort (production or communication) which adds no value to a product or service.
  5. Inventory: Any supply in excess of process or demand requirements.
  6. Motion: Any movement of people which does not contribute added value to the product or service.
  7. Defect: Repair or rework of a product or service to fulfill customer requirements.

It’s important to understand “Value” in terms of the customer.  From the customer’s perspective, “Value” could be defined in the form of a question:

Which process steps (and associated costs) do our customers not have to bear?

indigestion, process bloat, wasteIt’s a revealing question — most companies are glad that they do not have to reveal how their product or service is created, for fear of their inefficient processes and wasteful operations revealed to the customer.  This stance is sometimes aptly called “not revealing how the hot dog is made”, amicably referring to the unknown contents of the hot dog.

Process Cycle Efficiency

There is a metric that helps to identify how much of a process is actually value-added.  It requires a few things:

  1. Map the process.
  2. Identify the Value-added steps, non-value added steps, and the non-value added but necessary steps.
  3. Stratify your map according to the items in #2
  4. Add a time dimension to the process steps.

Once you have completed steps (1) – (4), then you can simply calculate how much is actually value-added, as a percentage.  The time for the entire process — end-to-end — is called a cycle time.  To identify the Process Cycle Efficiency, you just divide the value-added time by the cycle time for the process.

Process Cycle Efficiency = (Value-added Time / Cycle Time)

For example, take the hypothetical process below:

indigestion, process bloat, waste

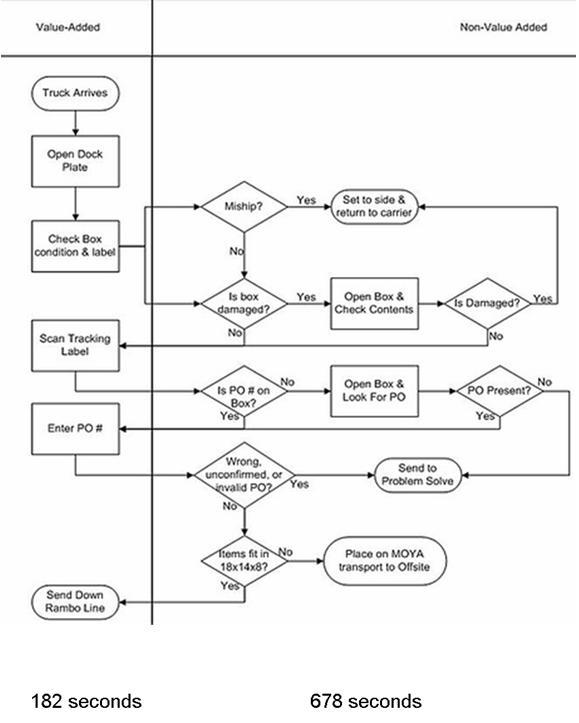
The process above has a cycle time of 860 seconds.  So, the Process Cycle Efficiency could then be calculated by doing the following:

Process Cycle Efficiency = 182 / 860 = .21, or 21%

In other words, only 21% of the process above is considered value-added to the customer.

the customer would consider 79% of the process above as waste

Put another way, the customer might be bearing 79% of the cost associated with the waste above.  Knowing this, the firm should aim to increase the Process Cycle Efficiency of the process by eliminating or reducing the waste.

Data like this can help the firm increase their value-added percent to the customer by eliminating or reducing the waste in their process.  Doing this would put the customer first and allow the firm to “get their house in order.”  I consider the above exercise to be simple, yet incredibly helpful for the firm to make sure that they provide maximum value to the customer; it’s a fiduciary duty to the customer.

Think about your processes?  How much is really value-added to the customer?

search terms for this article:

six sigma process map, indigestion, lean six sigma process mapping, process cycle efficiency example, lean process mapping, accounting cycle flow chart, accounting cycle, car manufacturing process flow chart, indigestion diagram, lean process cycle efficiency, lean six sigma process map, process cycle chart, waste factory, what is indigestion, supply chain flow chart template, accounting cycle steps, factory waste, production cycle flowchart, lean process flow chart, semiconductor process flow chart, apple supply chain process flow, apple supply chain flow chart, factories waste, toyota manufacturing process flow chart, lean process map example, production cycle process, purchase cycle flowchart, time efficiency, process mapping six sigma, six sigma process map example, lean process improvement, supply chain flow chart, lean manufacturing flow chart, manufacturing process map examples, flow chart of car manufacturing, manufacturing process mapping examples, hospital kitchen process mapping, lean process flow diagram, process flow chart manufacturing products examples, product process cycle, kaizen process flow chart, lean process mapping examples, identify cycle times for a process map, examples of process waste, process map with cycle time, lean way of step by step process mapping to identify value add and non value add activities, efficiency flow chart, manufacturing cycle time process map, process map value added, process map of warehouse management system, machining process flow chart, purchasing cycle flowchart, six sigma with lean with pics or diagram, graph of hidden supply chain costs, six sigma and lean production flow charts, six sigma efficiency, flow chart of zipcar\s constant improvement, lean six sigma map, manufacturing terminology process flow cycle, lean six sigma process flow, lean process map, process mapping examples, sample process map manufacturing, Lean Management Efficiency Template, flow chart of procedure for identification schedule waste, efficiency cycle time, bloat process, organization spaghetti flow chart, manufacturing process mapping template xls, customer fulfillment flow chart, cpu processing cycle, process bloat, company efficiency flow chart, cart of types of non value added waste, value addeded and nonvalue added flow charts, process flow efficiency, inefficient process, map process cycle time, online order fulfillment process flow chart, value added process flowchart of a medicine processing, car manufacture process flow chart, pce =value add time, time efficiency chart, diagram of indigestion, process efficiency map, value added mapping template, cycle time flow chart, manufacturing process cycle, production PROCESS cycle time, process efficiency charts, processes mapping in in the gaming industry, process value efficiency six sigma, process time efficiency, process mapping value, process flow chart for car manufacturing, process flow chart for motor bike manufaturing, production process flow chart examples, process observation waste map, process efficiency in 6 sigma, process maps and cycle time

Related Articles:


This post was written by

{ 2 comments… read them below or add one }

Scott Edwards April 22, 2009 at 9:01 pm

Great post as usual. I’m in the semiconductor industry and I’d say lots of our waste is due over-production. And the conventional wisdom for the most part is we have to live with it. Some major obstacles that prevent reduction in over-production are: 1) Immense pressure to keep capital utilization high – $3B investment in a fab that will be obsolete in less than 5 yrs. 2) When production starts, it is not known what the exact products will be at the end of fabrication (due to semiconductor process, different CPU speeds is the end result even though each die is the same). Thus keep the tools running and scrap what we don’t need in the end is the prevailing mantra. Talking about cost accounting gets nowhere because of the sheer expense of fabrication investment. Would be interested in your thoughts on tackly over-production in this respect.

Reply

David Bainbridge May 23, 2009 at 5:33 am

Most software companies have complete systems dedicated to the management of bugs … the developers introduce them – but don’t know how many – then we have a game: How many bugs can the testers and customers find? We also have whole process segments and supporting tools dedicated entirely to handling bugs. Do we produce products for customers to use – or are products just hosts to bugs? … Either way we seem to spend more time on the bugs than we do on the products. So if we are talking about Hidden Factories then the Bug Factory has to be the mother of them all … Value to the customer? Well, I am sure they would rather have a product that worked …

Reply

Leave a Comment