I went on vacation last week to Disneyland. We had a lot of fun. It was also a time to learn how organizations like Disneyland deal with queueing challenges, especially with systems under high stress and load. In this post, I want to cover the Psychology of Queueing and how Disneyland satisfies several of the positive properties. You can also view all 40+ articles on Queueing Theory.
There are a few key behavioral responses or reactions to queues, or waiting.
Wait Time Psychology Principles
Below are the propositions:
- Unoccupied time feels longer than occupied time.
- Process-waits feel longer than in-process waits.
- Anxiety makes waits seem longer.
- Uncertain waits seem longer than known, finite waits.
- Unfair waits are longer than equitable waits.
- The more valuable the service, the longer the customer is willing to wait.
- Solo waits feel longer than group waits.
In almost every ride at Disneyland, they provide the following metric at the beginning of the ride:
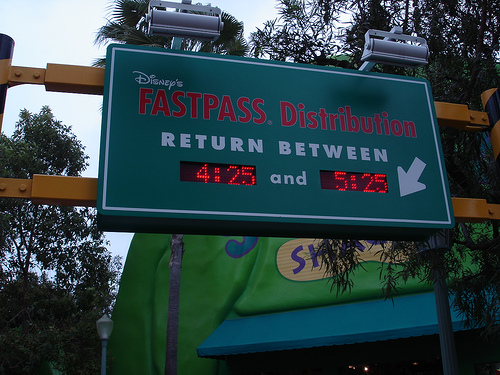
The message above signals to the customer approximately how long she or he is expected to wait. This strategy satisfies property 4 of the Psychology of Queueing — it is no longer an uncertain wait, but a finite (albeit seemingly long) wait. This helps to manage the customer’s expectations or helps the customer decide whether he or she is willing to wait or willing to move on to a different ride. This visual display is a simple, yet powerful move that helps the customer.
Now, to arrive at the average wait time above, requires some understanding of the physics of queueing. The physics of queueing that helps us approximate the average wait time is below:
- λ = Arrival Rate, or more specific, the time between arrivals. For most queues, we can assume that the arrival distribution can be approximated by a Poisson distribution; which means that the time between arrivals are not deterministic, but random.
- μ = Service Rate, or more specific the time for a arrival to be serviced.
So, we get the following to conclude the average wait time:
Tw = (λ / μ(μ – λ))
The calculation is simple, yet powerful. Couple the physics of queueing with a positive approach in the psychology of queueing, then you’ll better manage the expectations of your customers, better forecast the load and requirements of a system, and better predict requirements on labor or resources.
Become a Lean Six Sigma professional today!
Start your learning journey with Lean Six Sigma White Belt at NO COST


Peter says
Last week I was at a seminar featuring the very lean guy John Bicheno, and he told a similar story about the psychology of queueing. He told that elevator manufacturers knows that people hate standing in line at elevators, but that almost disappear if a mirror is introduced. Suddenly there is something to do while standing around waiting. It seems simple, yet very powerfull.
james says
Hey Peter,
I don’t think they used that formula for that approx wait time. I would imagine that it would be as simple as knowing how many people on average can fit into the physical line and knowing the service time.
I agree that it is really comforting knowing what the wait time will be and even more comforting when that wait time is actually shorter than shown!
psabilla says
@James,
No, that is definitely the equation used to calculate average wait time.
Comfort — good point, but it helps to be honest, though. Honesty has the added effect of building trust that the average wait time is approximately correct. If a lower number than the actualy calcualated number was shown, it would most likely build distrust in customers because after x time has passed, the line still has more to go before the customer is served. Plus, it’s just good business to be honest.
Ron G says
Hi, I enjoy your blog. I think James is correct that the equation you provide is not what Disney would use to calculate the waiting time. The equation you provide is ffor a M/M/1 queue, which has alot of assumptions including steady-state, Poisson interarrival times, and Poisson service times. Living in Florida and having been to Disney World several times I would say the variation in service times is low for many attractions due to the way they stage guests in front of the rides. While not deterministic, it is close. Also, I would guess the arrival rate for most attractions is usually greater than the service rate during peak times of the day for these attractions (so lambda > mu). In other words, the system is not in steady-state, and therefore the equation is not valid.
Laura Hamelin says
Hi everyone,
I really enjoyed this blog and I was wondering if anyone could help me. I am a fourth year business student and I have to provide simple calculations for average waiting time at one Disney World ride. The equation I am using is the exact same as the one first mentioned (it may not be
100% accurate but for the purpose of this class it is just right). Anyways, my problem is that I cannot find any statistics regarding number of arrivals or average number of customers who complete the ride in a given time period. If anyone could help it would be greatly appreciated!
Thanks in advance,
Laura
William says
Your equation is written in a confusing way and it seems wrong. It looks like you mean to divide lambda by the rest of the equation but that does not work. For lambda = 2 and mu = 1 the wait time woud come out to -2. If the (mu – lambda) is intended to be in the numerator rather than the denominator then the wait time would still comes out to -2 for these numbers. Either of those interpretations of the text gives a wrong answer because wait times can never be negative.