Do you find our site valuable? So do many others!
Reach our audience through targeted advertising options, such as:
- Advertise your product/service on Facebook post to 2,000+ likes and 70+ twitter followers (new account)
- Advertising buttons throughout our site
- Email blast to 18,000+ subscribers
- Links embedded within appropriate articles and posts
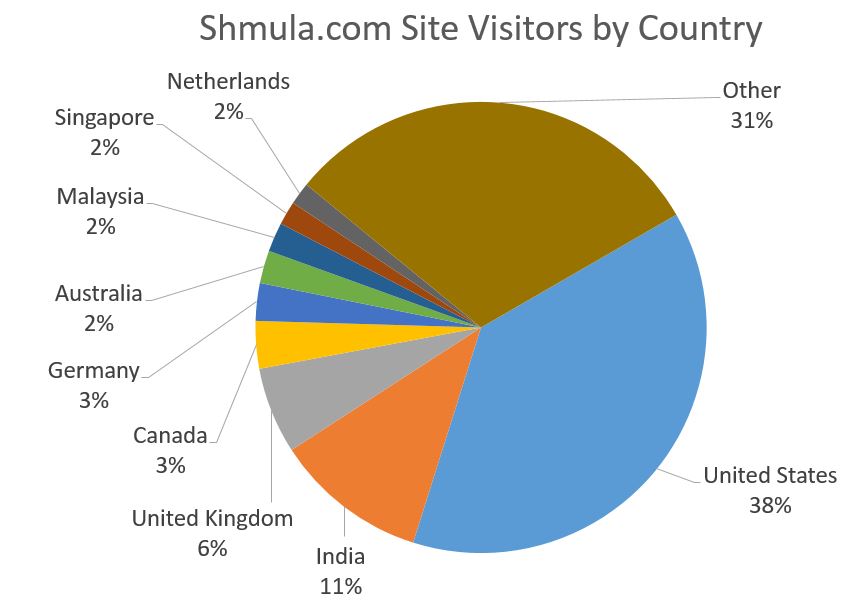
About our site visitors (Updated for Jan-Aug 2016):
- Average Visitors per month = 30,000
- Pageviews per month = 55,000
- Average Duration on website = 1:09
- Age, Income and Gender demographics coming soon!
Want to learn more about advertising, or have a suggestion on how we can help you get the word out? Contact us!