eCommerce Shipping Strategy: Delivery Times and the Supply Chain. How to make shipping a strategic imperative in order to delight the customer.
The order fulfillment process in eCommerce is critically important. Most companies focus on the front-end, but those that win, emphasize all the customer touchpoints, not just the purchase side of the funnel, but the back-end of the purchasing process also.
Most online businesses that sell hardgoods explain delivery times as the following:
{[click + buffer + fulfillment processes] + [delivery time]} = [Total Delivery Time]
The equation above is common in fulfillment operations, assuming the inventory is housed somewhere, such as a warehouse, not at a 3rd party vendor.
From a company’s perspective, the equation above shows where the improvement can be made — yes, the fulfillment process because that is the part that is within control. Once it leaves the warehouse, it is up to the Third Party Logistics Vendor — UPS, FEDEX, USPS, etc. Amazon explains this relationship with the following diagram:

From the customer’s perspective, it is good to know the overall process, such as described above. To find out, however, how the company is doing in reality is a different story — that is, empirically, how is the company doing in regards to getting stuff to the customer in an eCommerce environment?
Time based data is critical in empirical studies of this sort. For the process above, we need to know the “click” timestamp and the time the customer signed for the product. That would give us an end-to-end picture of our service in terms of getting the customer’s order to them within some timeframe. Using the data I suggested, you would end up with continuous data over time t. This aggregate data can give us several key measures of how the company is actually doing in regards to delivery times, using empirical data.
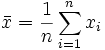
The first measure we would arrive at is the mean, or the average.
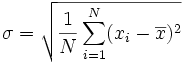
Then, we would calculate the standard deviation.
Given the data set, we would want to know the distribution of the data; the data will most likely be approximated by the Normal Distribution. We want to know this, so that we can apply the above measures in an important way: Given the Mean, we can calculate that (1 Standard Deviation) from the Mean (+/-) what 68% of the orders will be delivered in.
For example, if we determine that we are, on average, delivering orders at 5 days, with a standard deviation of 3 days, then, we can conclude or approximate, that 68% of orders will be delivered within 2 to 8 days. The 68% number can be used if and only if the data is described by a normal distribution. Here’s a picture of what I’m trying to explain:
Below is a hypothetical map of what an order system might look like. This system involves a front-end store, credit card verification, and warehousing activities:
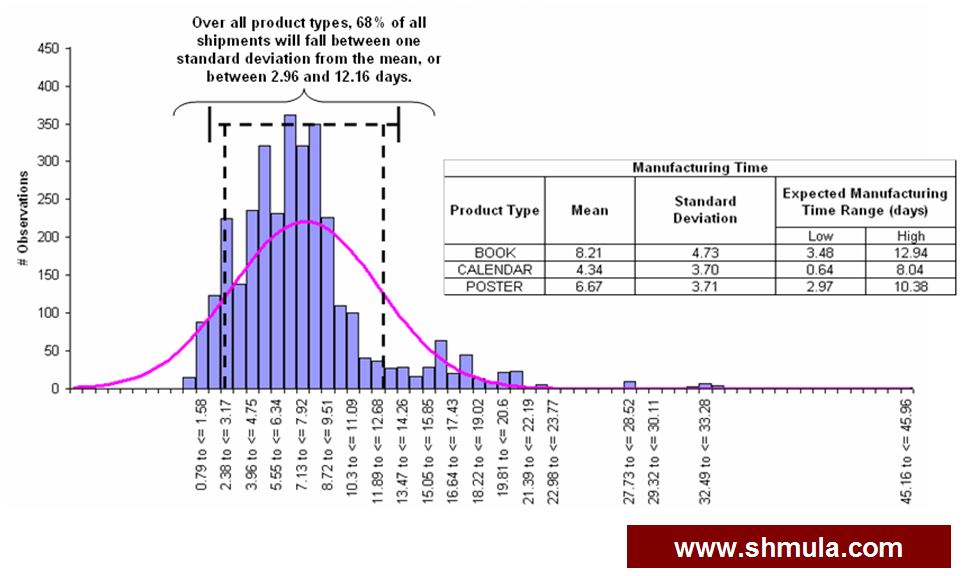
The image above shows a data set that fits a normal distribution; the mean is calculated and so is the standard deviation. Given that the data fits the normal distribution, we can conclude that the data shows delivery times to be between ~3 and 12 days.
Why is this Important?
It’s important in several ways: (1), knowing this will help us better understand the customer experience — that is, when do they typically receive their stuff. The range of ~3 to 12 days is arguably a bad customer experience — there’s no smoothing effect here, but highly variable. The goal is to reduce variability so that the customer can have confidence in the company’s delivery estimates; (2) this empirical data can help the company pin-point where improvement opportunities might be; (3) this data might provide insight into product or lead to new product or shipment types.
*NOTE: The above is relevant in any process where there is a vendor-partner relationship or build-to-order process.
It’s about the Customer
Again, it’s about the customer. Online shopping is the norm and online companies need to know, empirically, how they are doing; what their service level is like. Following the above will help in that process and allow the company to better understand the customer experience and improve accordingly.
Become a Lean Six Sigma professional today!
Start your learning journey with Lean Six Sigma White Belt at NO COST


Leave a Reply