There is wisdom in the definition of Six Sigma, which is 3.4 defects per one million opportunities (DPMO), allowing for a 1.5 Sigma shift. But, some companies subscribe to sloganeering such as “Zero Defects“. The “Zero Defects” sloganeering is counterproductive, unhelpful, statistically impossible, and completely cost prohibitive.
| Other Poka-Yoke Examples and Articles | |
Statistically, zero defects means a defect level of infinity sigma, which is not possible. What most people mean, is an attitude toward process improvement — relentlessly improving the way we do things, the product or service we produce, in order to continually delight the customer. That is really what people mean. But, but the “zero defects” sloganeering gets in the way.
Are All Defects The Same?
The “Zero Defects” movement has an implicit assumption that all defects are equal. This is not true. In fact, for most firms and products, defects must be identified and prioritized, and attacked and treated from most important to least important. For the defects at the bottom of that prioritized list, it might even make sense to move on and not eliminate or reduce those. The point here is an attitude toward perfection, but fully understanding that perfection is not possible. The attitude and efforts are valuable and the customer will feel and appreciate it. Shareholders will benefit, and the firm will be better for it.
Types of Costs
There are three types of costs that comprise the cost of quality: Appraisal, Preventative, and Failure costs.
Appraisal Costs
The costs in this category includes any and all activities in identifying and assessing for errors or defects in products. For example, testing is an activity that falls in this category; a department that might fall in this category is the Quality Assurance department ” this department’s burden would fall under the Appraisal Costs category.
Preventative Costs
The activities that fall under this cost category are training, and any and all activities the encourage prevention or discourages introduction of defects. Establishing processes, procedures, and systems prior to the product being built is typically found in this category. Money spent in this category is money well-spent!
Failure Costs
Failure costs can be both Internal and External. Internal Failure Costs can be money spent to fix defects caught within the firm. For a software firm, money spent on fixing bugs caught prior to shipping a product can fall in the internal failure costs category. For External Failure Costs, these are activities that involve refunds, complaints, call center functions (not outbound sales, but inbound complaints), concessions to the customer for poor service, and warrantees.
Zero Defects and Costs
I present below what I believe to be the relationship between costs and defects:
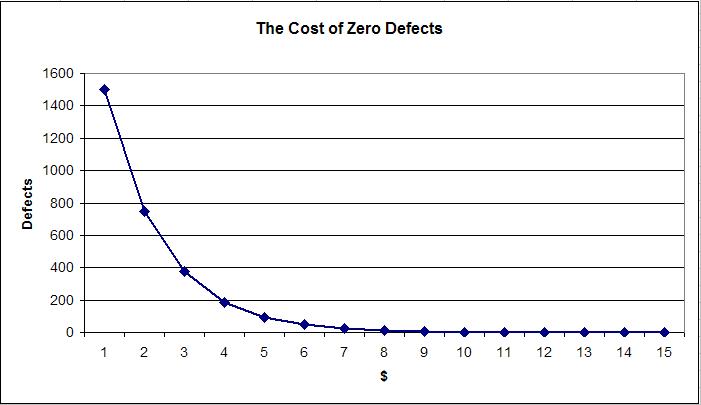
On the X-axis, we see the costs category (just use a dollar multiplier for the X tick marks). On the Y-axis, we see defects, by count. So, we see that as defects approach zero, costs increases exponentially and hovers asymptotically on the x-axis, and never reaches zero.
Footnote: The costs to a firm where there is no effort to identify and reduce errors or defects can also be exponential. For example, imagine a firm where there was no inspection, appraisal, or prevention of faulty, defective, or harmful medical devices or drugs. The external failure costs alone could bring the firm to bankruptcy. I recognize this fact, but wanted to make a point above regarding zero defects.
Why is the above Graph True?
As defects are identified and eliminated, there will be theoretically few defects. But, this means that identifying defects will require more effort and will become more and more difficult, thus increasing the costs of this activity, along with the subsequent costs to fix the defects identified: The costs to inspect and test increases as there are fewer and fewer defects.
A Caveat & Poka-Yoke
As defects are reduced, the Appraisal cost increase — that is, the cost to detect a defect grows. There is a trade-off. One very effective way is to implement Poka-Yoke: to mistake-proof our processes and prevent service or product defects all-together.
Conclusion
Sloganeering doesn’t help, especially if the slogan makes no sense. “Zero Defects” as a mantra has a nice cumbaya ring to it, but doesn’t really help or motivate a crew to do better. Moreover, “Zero Defects” is statistically impossible as well as cost prohibitive.
Regarding defects: not all defects are equal. It is important to identify the defects that impact the customer, prioritize those, then respond in a prudent way in improving the product or process. Going after all defects is not prudent.
The key takeaway here is the following: strive to be better everyday; strive to make the customer happy. The Firm’s efforts to make the customer happy will be felt, a culture of improvement will be created, and the firm and shareholders will benefit from it.
Become a Lean Six Sigma professional today!
Start your learning journey with Lean Six Sigma White Belt at NO COST


John says
Good article. Utah DOT has had a campaign “Zero Fatalities” yet in the last year fatalities have gone up. Nationwide, 45,000 died on the highways last year – to go to zero is certainly unlikely in the near future. I think too large a goal has the inverse effect of overlooking small, but continuous improvement.
Rob says
Zero defects makes no sense to me, in fact I posted a couple of articles about it
here and here
Bill Wilson says
I really don’t disagree with anything you’ve said here, but I would like to point out that another interpretation of “zero defects” is possible. If you take into account Crosby’s definition of quality as “conformance to requirements”, and if your requirements are stated statistically, then “zero defects” essentially equates to a performance standard of “no special cause variation”. Of course, Crosby probably didn’t mean “zero defects” in exactly that sense, but in my opinion, his overall sentiment was not so different from that of the other big quality pioneers: establish meaningful standards of performance, monitor that performance, take corrective action when required, and seek overall improvement where-ever (and whenever) possible.